Blog
Arduino Serial Plotter Basics

The Arduino serial plotter is a super handy tool provided you know the basics of how it works and when to use it! The serial plotter will take data sent to the serial monitor and plot it on a graph. It can even take multiple data sources and combine then into a set of overlapping graphs. It’s incredibly useful for projects that need to capture and represent values that change over time, such as temperature or humidity.
Note 1: To use the serial plotter, the serial monitor must not be open. Close the serial monitor before attempting to open the serial plotter.
Note 2: To use the serial plotter, the Arduino must be connected to your PC or Mac via USB.
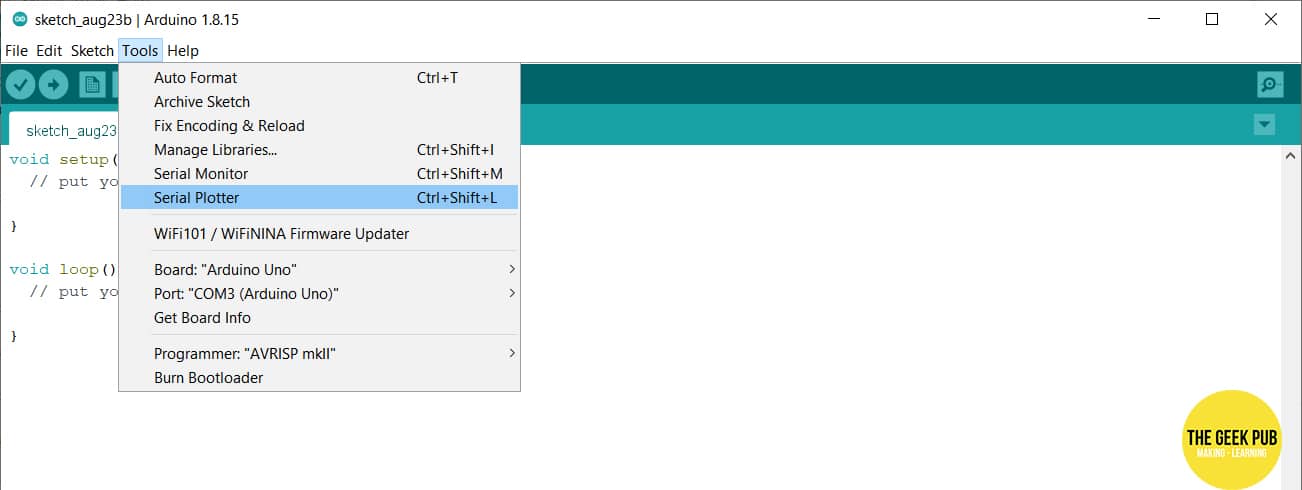
To open the serial plotter: In the Arduino IDE, go to Tools, and click on Serial Plotter.
The Arduino serial plotter will open. As long as your Arduino is not currently executing a sketch that outputs to the serial console, the plotter should be empty.
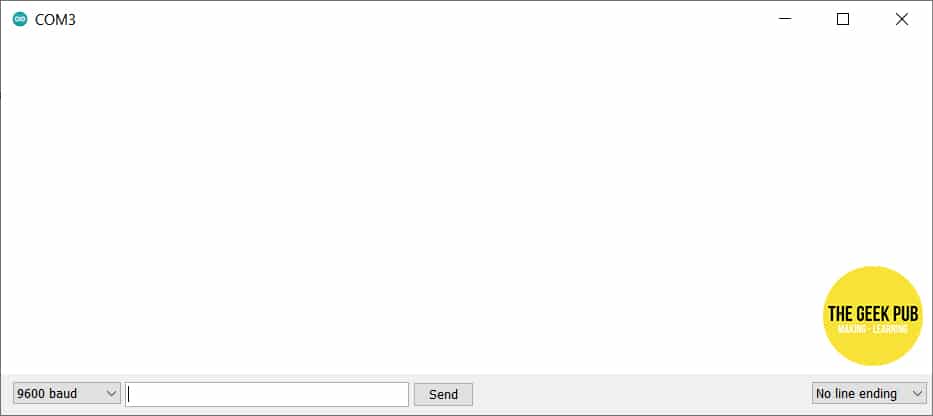
But it’s time to make something show up! Let’s send the plotter some data to graph!
Arduino Serial Plotter / Single Graph
Let’s start with just showing a single data set. Something very simple. We’re going to create a sketch that counts up to 10 and back down (so 1 to 10, and then 10 back down to 1) and then see what that looks like in the serial plotter!
Enter the following code into the IDE, and send it to your Arduino:
int mynum = 0;

void setup() {
  // put your setup code here, to run once:
  Serial.begin(9600);
}

void loop() {
  // put your main code here, to run repeatedly:
  for (mynum = 0; mynum < 9; mynum++)
  {
    Serial.println(mynum);
  }
  for (mynum = 9; mynum >= 0; mynum--)
  {
    Serial.println(mynum);
  }
delay (10);
}
Once the code is on the Arduino, open the Arduino serial plotter and have a look! You should see the following output on the plotter! This is the graphed representation of counting up to 10 and back down.
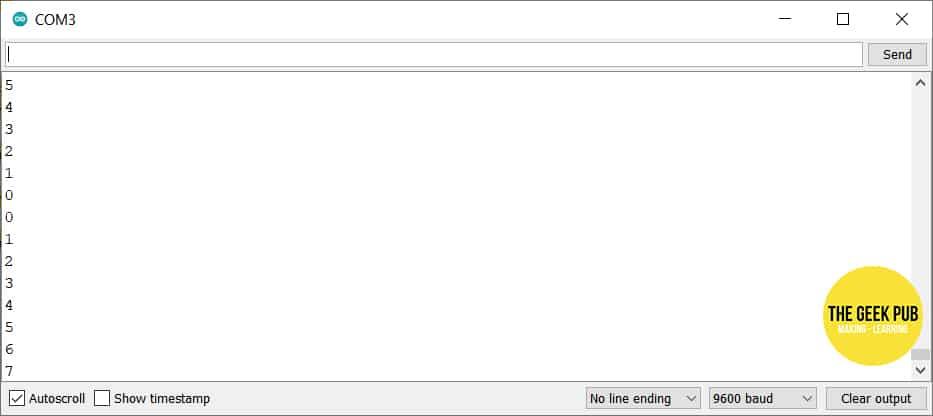
This is just graphing regular data coming from the serial port. Close the serial plotter and open the serial monitor (they cannot be open at the same time). You’ll see the numbers are flying by on the console! The plotter is just another way to see the same data.
Now let’s try another approach. Let’s read and graph the output of one of the analog pins on the Arduino with nothing attached to it. Enter the following code into the IDE and send it to your Arduino:
void setup() {
  Serial.begin(9600);
}

void loop() {
  int myanalogpin0 = analogRead(A0);

  Serial.println(myanalogpin0);

  delay(100);
}
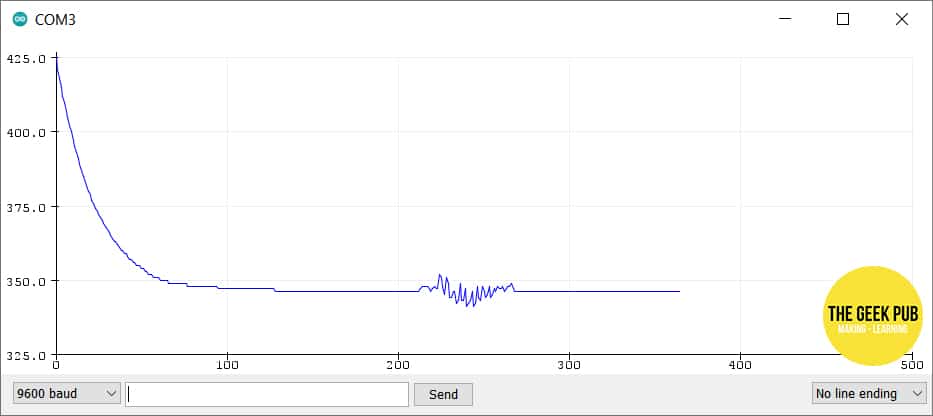
Then open the Arduino serial plotter. You should see something like the following output. Move the Arduino around on the table physically. You’ll notice that just you handling it will change the reading on the plotter! You can see on my graph where I picked up the Arduino and moved it. This is just stray static electricity in the air effecting the reading.
Arduino Serial Plotter / Double Graph
In order plot more than one data point on the plotter, we have to do a little more work… but honestly… not that much!
We need to identify the data points in our output so that the Arduino serial plotter can separate them. To do that we will add spaces between each number in our output. To do this we need to use the Serial.print() function for the first two data points, as it does not send a newline at the end of its output. For the last data point we will use Serial.println() as usual.
Enter the following code in the IDE and send it to your Arduino. This will plot three different sinewaves based on simple formula.
void setup() {
  Serial.begin(9600);
}

void loop() {
  for(int myctr = 0; myctr < 360; myctr += 5) {
    float y1 = 1 * sin(myctr * M_PI / 180);
    float y2 = 2 * sin((myctr + 90)* M_PI / 180);
    float y3 = 5 * sin((myctr + 180)* M_PI / 180);


    Serial.print(y1);  // print value 1
    Serial.print(" "); // seperate the values with a space
    Serial.print(y2);  // print value 2
    Serial.print(" "); // seperate the values with a space
    Serial.println(y3); // print value 3 with a newline (println)

    delay(100);
  }
}
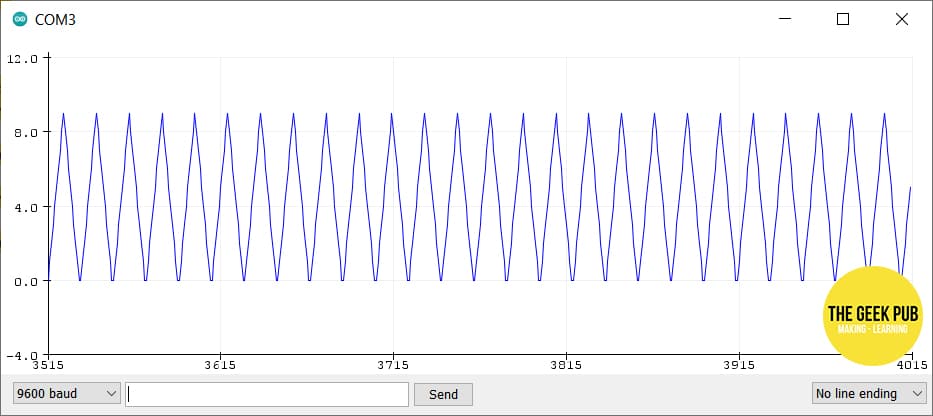
The output after a minute or so should look like this:
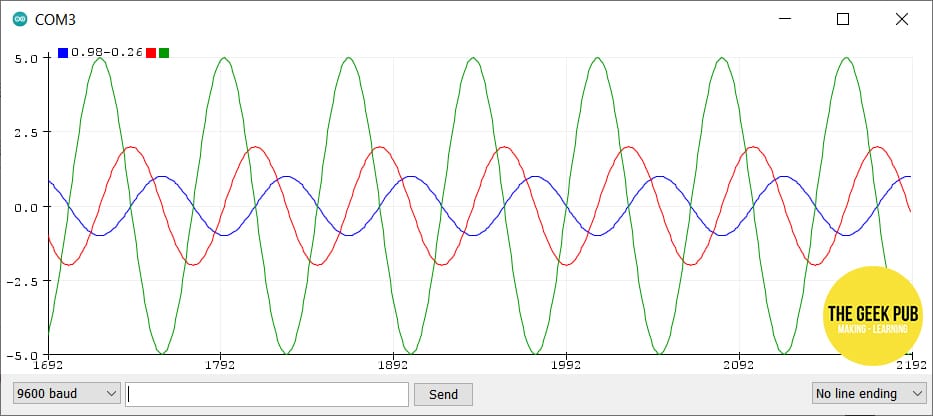
You should adjust the numbers in the formula and see how those change the sinewaves!
Next Steps
Now that you know all about the Arduino serial plotter, you should take the next steps to learn more!