Blog
Custom Observium Dashboards
If you’ve seen any of my videos, like the recent Tour of My Home Network then you’ve probably seen my custom Observium dashboard. I am asked multiple times per day how I was able to produce this custom dashboard on Observium in the YouTube comments, through email, and here in the comments on The Geek Pub. The reason why is simple. Observium, for all of its awesome abilities and sheer coolness lacks such a simple feature: The ability to create custom dashboard screens. I have personally sent the authors this request numerous times, as have my of my peers in the industry. It’s a shame because it is definitely something that would help sell the product.
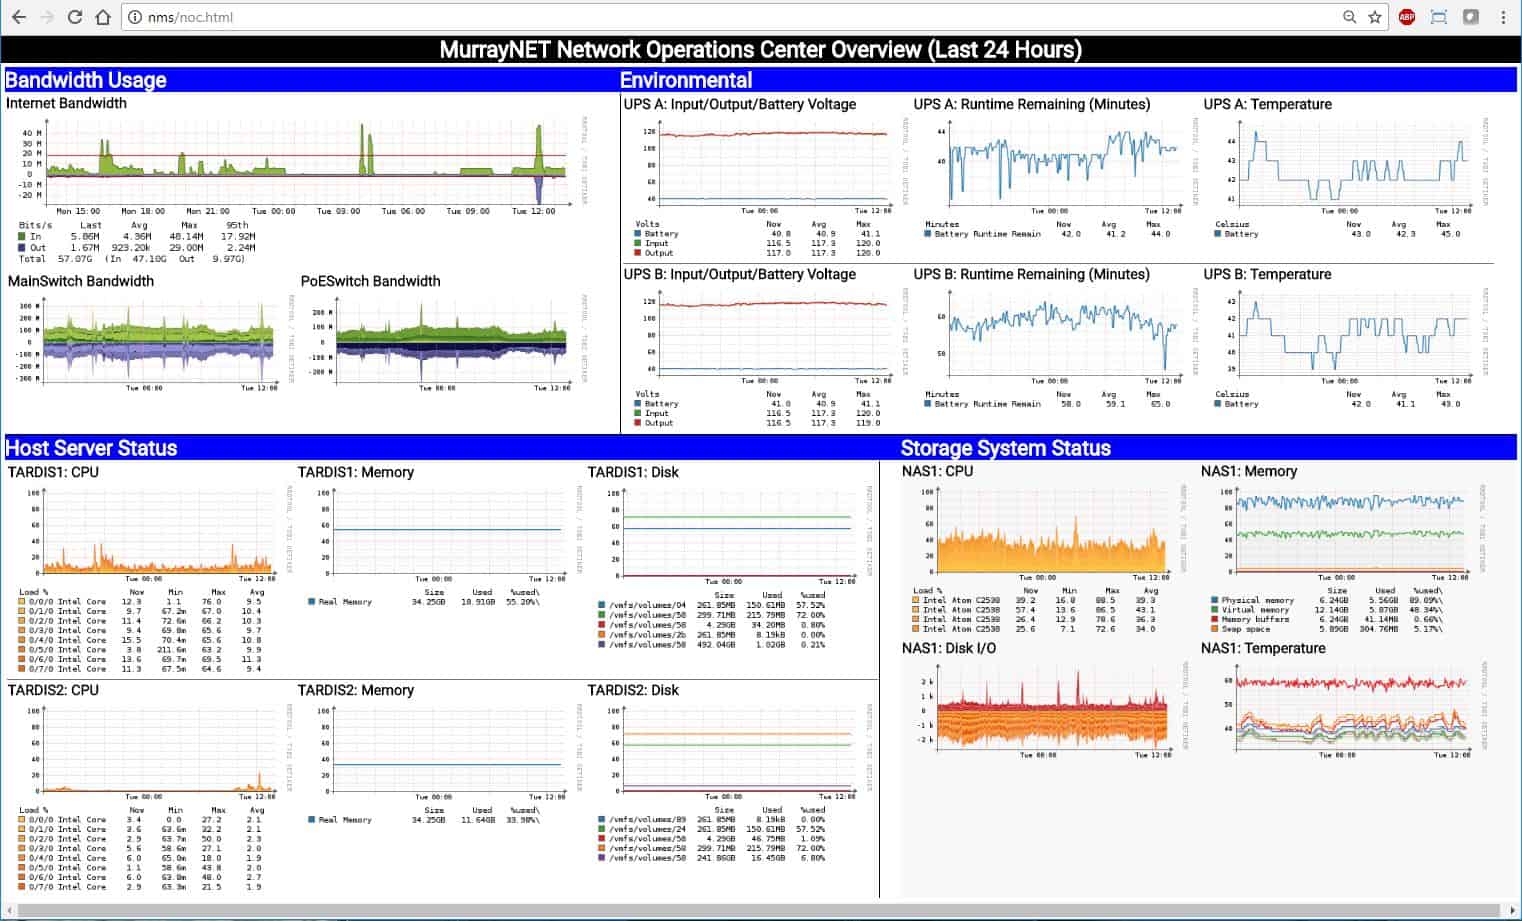
My Custom Observium Dashboard
The dashboard I use in my home Observium install is pretty simple. I just wanted something that shows the basics of what’s happening around my house. I was specifically interested in the performance of my Internet connection reported by my pfSense Firewall, the status of my ESXi servers and Synology RS2416+ NAS appliance, and the environmentals and status from my Tripp-Lite Rackmount UPS.
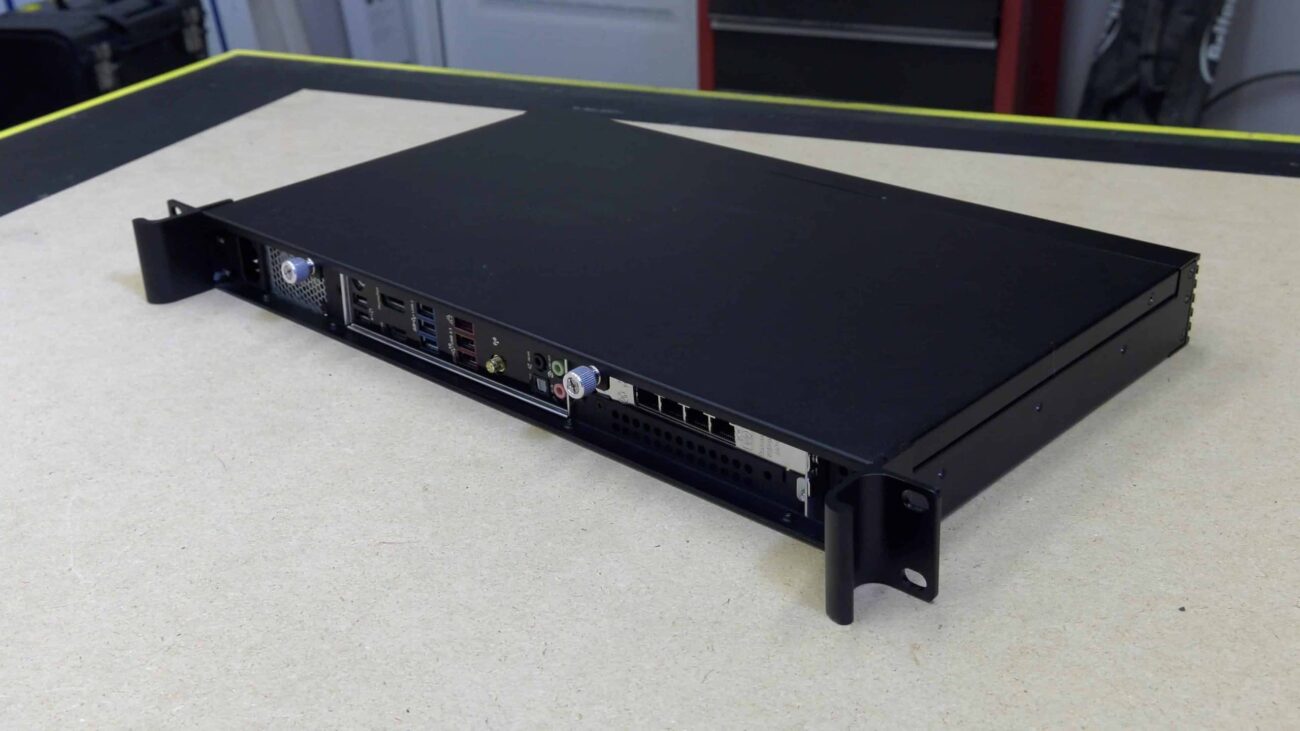
The display PC I setup a running Windows on a cheap Gigabyte Brix I got from Amazon with the following configuration:
- I configured Windows to login automatically to a dummy account (local account).
- I added Chrome to the Startup Folder with the -kiosk switch which runs Chrome in full screen.
- I set Chrome’s default home page to the URL of my custom Observium dashboard.
This really turned out nice, because after a power failure this PC (not on a UPS) will boot back up and immediately load my NOC page from my server (which is on a UPS). I really works quite well and it also takes care of reboots when Windows 10 automatically installs updates. The PC just reboots right back to this NOC display. I keep the Gigabyte Brix velcroed to the back of the monitor and run it without a keyboard or mouse. It sets on a shelf in my bookcase.
You can see my dashboard here. (Click to Enlarge)
How to Make Custom Observium Dashboards
Due to all of the requests, I’ve decided to take a minute and write a quick tutorial on what you need to do to make a custom dashboard. The guts of the dashboard can live on the Observium server or somewhere else entirely. To host it on the Observium server you’ll just place the files in the root of the Observium HTML folder. This scares a lot of people, so alternatively just spin up another webserver VM (Windows or Linux is fine) and place the customer Observium dashboard page in the root of it’s HTML directory.
I am not going to go into how I setup my display PC, but there are hundreds of articles on the web that will teach you how to auto-login and auto-start Chrome if you need help. Additionally, I am not going to give a tutorial on HTML, but you’ll probably need some basic HTML expertise to make a decent dashboard.
Configuring Observium for Custom Dashboards
In order for your custom Observium dashboard to work, you’re going to need to change some settings inside Observium. This will need to be done to the config file, or in the web configuration page depending on how you setup your install of Observium.
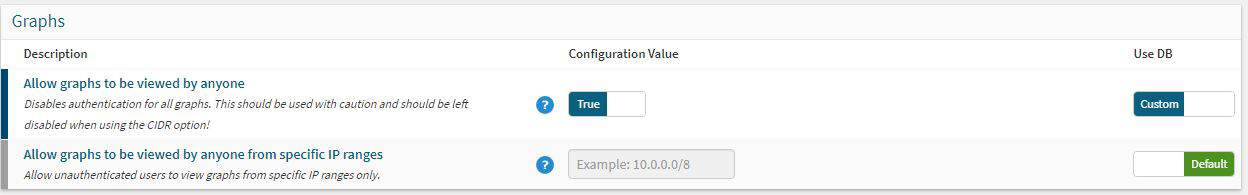
Allowing Graphs to be Loaded without Logging In
The most important setting you’ll need to change is to allow graphs to be loaded without logging in. Otherwise your NOC display will just show permissions errors when trying to display the graphs. Some might think this is a security concern, but it’s really not. Observium allows you to set an IP address or range of IP addresses that are allowed to view the graphs without logging in. In my home environment, I simply let all IP addresses access the graphs. If you’re concerned about this, or this is a corporate network, just put the IP address of your NOC display in the second box and you’ll be fine.
It sometimes seems like it takes Observium a few minutes to catch up with this change, so if you see a problem give it time for the next polling cycle to run (about 5 minutes in most cases).
Getting the Observium Image URLs
This is one of those other annoyances form the developers of Observium. They don’t make it easy to get the image URL for using on remote embedded pages. You say “Wait Mike! There’s a link on every graph page that says “Link to Graph!” Oh yeah, you mean this one:
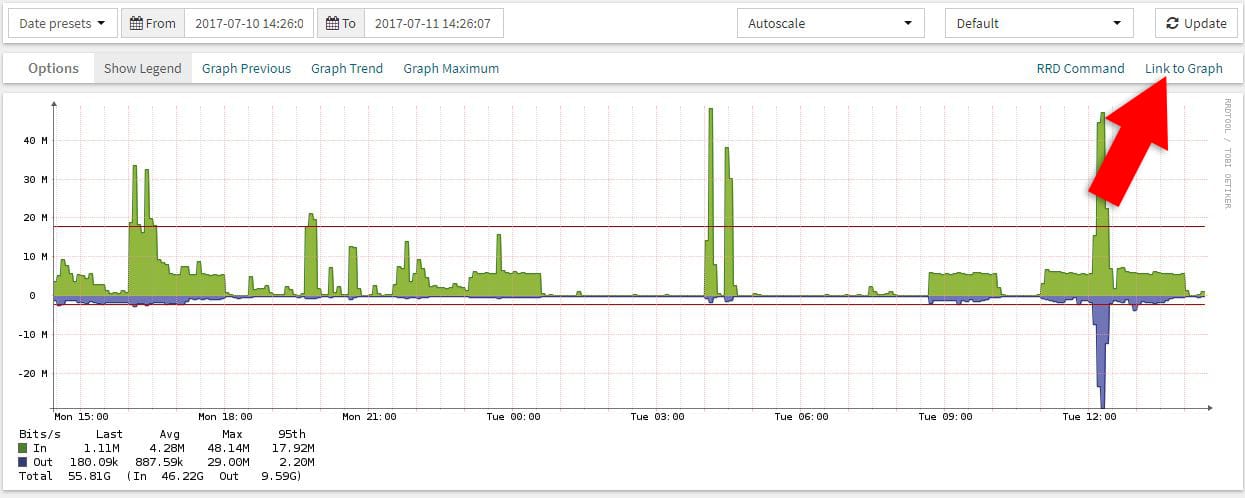
Well, that link has a fundamental flaw for our uses. It links to a point in time graph. In other words, if you use that link, it will show the same data it shows right now in perpetuity. In 24 hours, it will be showing 24 hour old data. In a year, it will be showing a year old data. For our dashboard we need to be showing the last 24 hours (or whatever number you decide on) rolling. This means each time the graph is reloaded it will be showing current data! The good news, it is easy to fix!
Getting a Rolling Observium Image URL
Go ahead and click that “Link to Graph”. Then copy and paste the URL into a Text or HTML editor. It should look something like this:
[code]http://nms/graph.php?type=port_bits&to=1499801167&id=33&from=1499714767&height=300&width=1152[/code]
In this URL there are several parameters on the query string such as type, id, from, to, height, and width. You can modify all of these to get the graph you really want, sized to the dimensions you’d like for your home page. You can also turn the legend off by adding &legend=no to the end of the query string.
The main two we need to focus on right now are “from” and “to”. By default Observium puts the actual Unix time-stamp of the start and end of the graph in the URL. This is why they become fixed points in time. For our custom Observium dashboard we’re going to make them real-time! The two parameters “from” and “to” can take additional types of inputs. For example setting “from=-24h” tells the graph to display day from 24 hours ago. Setting “to=now” tells the graph to display data up to the current time/date. Setting both of them at the same time will result in a graph that displays data from exactly 24 hours ago to right now. This data will be refreshed each time the page is loaded! That URL would look like this:
[code]http://nms/graph.php?type=port_bits&to=now&id=33&from=-24h&height=300&width=1152[/code]
Not to hard to do once you know the tricks! You of course could make these graphs any time length you want. -6h for six hours, or -1h for one hour. You can decide what works for you.
Putting it all Together
As I mentioned previously, creating a webpage is out of scope for this article, but the gist of it is to simple embed these images on a blank webpage in a set of tables of DIVs. You could even embed them into a WordPress page or some other CMS. If you need a basic HTML page to start with, you might look at Twitter’s Bootstrap. Bootstrap provides a nice framework all ready to go.
Embedding the Images
The embed code would look something like this. Place it in your HTML between the <BODY> and </BODY> containers.
[code]&lt;img src="http://nms/graph.php?type=port_bits&amp;amp;amp;to=now&amp;amp;amp;id=33&amp;amp;amp;from=-24h&amp;amp;amp;height=300&amp;amp;amp;width=1152" /&gt;[/code]
Refreshing the page Automatically
You’re probably going to want this webpage to refresh automatically on a timer. There are some Google Chrome plugins that do this, but its pretty simple to make the page refresh itself. Add this code to the HEAD section of your page:
[code]
<meta http-equiv="Content-Type" content="text/html; charset=utf-8" />
<meta Http-Equiv="Cache-Control" Content="no-cache">
<meta Http-Equiv="Pragma" Content="no-cache">
<meta Http-Equiv="Expires" Content="0">
<meta Http-Equiv="Pragma-directive: no-cache">
<meta Http-Equiv="Cache-directive: no-cache">
<meta http-equiv="refresh" content="60">
[/code]
And then add this code anywhere before the /BODY tag:
[code] <script type="text/javascript">
setTimeout(function () { location.reload(true); }, 60000);
</script> [/code]
Final Thoughts
That’s all there is to making a custom dashboard for Observium. You can put any graph you want on the page, organize them any way you like, etc. Another thing you can consider is making numerous dashboards. One for storage, one for telco/data, one for servers, etc. You can either show these on separate monitors, or you can use a Chrome plugin called tab-switcher to cycle between them every minute or two.
You can also pull other information from other systems in and show them on the same page! Enjoy and let me know if you have any questions below!
Mate. You just made my year. If you had a tipbox I would most definitely drop you a few $$!!
Great article! This is something I can’t believe Observium doesn’t have built-in! I will use the hell out of this.
Hi ! Thanks for the reply on the youtube comment that lead me to here. Exactly what i want. Thanks.
Awesome article, could you pleas put reference links into how your custom page was created.
Learn HTML and CSS
Thanks for the overview. I am no web designer so how do you get the graphs side by side? thanks!
Could you make video, a more detailed instruction related to this topic?
0.5